FVG Magnetism: Do Fair Value Gaps Really Fill?
Gap-fill physics is real. 78% of FVGs fill. The math is seductive. We ran it on 42 million ticks and watched the profit evaporate. OHLC daily inflated the profit factor by 4×. The gap fills. You still lose money.
The Eulogy
I’m going to bury a strategy I loved.
Fair Value Gaps were the first thing that made price action click for me. Three candles, a gap in the wicks, price rushing back to fill the void. The physics felt right. Imbalance begets correction. Nature abhors a vacuum. Every ICT video preaches it. Every Smart Money Concepts course sells the dream.
78% fill rate on 4H EURUSD. Profit Factor 6.7 on pure gap-fill trades. I stared at those numbers and thought: this is it.
I spent weeks on FVGs. Detection systems, fill rate measurements, backtests across timeframes, R:R sweeps, fractal cascades from daily down to 5-minute. I kept finding reasons to keep going because the math kept whispering yes.
Then I fed it 42 million EURUSD ticks.
No drama. No blowup. Just a slow, quiet bleed across every timeframe. The kind of death that doesn’t shock you — it embarrasses you.
The Lie Inside Every Daily Candle
Here’s the murder weapon.
I backtested FVG entries on OHLC daily bars. Profit Factor: 4.28. Beautiful number. Completely fake.
Bar-level simulation resolves your trades at the close, not at the intrabar price that would’ve actually hit your stop. A trade that should’ve died at 10:14 AM survives to the daily close — 40 pips away from where your stop sat, grinning like a corpse that doesn’t know it’s dead yet.
On tick data — where fills happen at the price that actually triggers them — that 4.28 collapses to 1.04.
Same strategy. Same data. Same parameters. Four times the lie.
And 1.04 is before spread, slippage, and commissions. After execution costs, you’re underwater.
Every price-action backtest you’ve ever seen on TradingView carries this risk. Not just FVGs. Everything. The daily candle is the most flattering mirror in all of quantitative finance.
The Death Gradient
If the daily number were a fluke, you’d see noise across timeframes. Some better, some worse, no pattern. Instead:
| Timeframe | Profit Factor | Verdict |
|---|---|---|
| 5 min | 0.80 | Loses money |
| 15 min | 0.94 | Loses money |
| 1 Hour | 1.04 | Dead after costs |
| 4 Hour | 1.17 | Faint pulse |
| OHLC Daily | 4.28 | Ghost |
Perfectly monotonic. Performance improves exactly in lockstep with bar coarseness. This isn’t a strategy getting better at longer horizons — this is OHLC resolution flattery. The fatter the bars, the bigger the lie.
At 5-minute, where bars most closely approximate tick reality, FVGs lose 20 cents on every dollar. At 15-minute, 6 cents. At 1-hour, breakeven. At daily, you’re a genius.
The resolution is the edge. Subtract it and there’s nothing underneath.
Sweeping the Exit — Still Dead
Maybe the entry works but the exit is wrong? I swept every R:R from 0.5:1 to 5:1 on full tick data:
| R:R Ratio | Profit Factor | Net Pips |
|---|---|---|
| 0.5:1 | 0.91 | negative |
| 1.0:1 | 1.02 | ~breakeven |
| 1.5:1 | 1.09 | marginal |
| 1.7:1 | 1.114 | +1,189 |
| 2.0:1 | 1.08 | declining |
| 3.0:1 | 0.97 | negative |
The ceiling: PF 1.114 at 1.7:1.
One honest detail worth keeping: the stop loss is FVG-edge-based, averaging 8-9 pips regardless of R:R. Only the take-profit moves. So this sweep isn’t curve-fitting the risk side — the ceiling genuinely is 1.114.
That ceiling is also the obituary. PF 1.114 means you make $1.11 for every dollar lost. Subtract EURUSD spread (~0.8 pips), slippage on entries and exits, any commission structure — you’re at breakeven or below. One bad month devours the entire edge.
You don’t trade a PF 1.114 strategy. You frame it and hang it on the wall as a reminder.
The Cruelest Number
Gap-fill physics works. On 4H EURUSD: 78% fill rate, PF 6.7. Real numbers. The gaps genuinely fill. If you could trade every fill, you’d make money.
The binding constraint is frequency: 18 trades in 2.5 years.
Eighteen. That’s less than one trade every two months.
You need gaps large enough to be real (not noise), that fill cleanly enough to hit your target, on a timeframe where execution isn’t an OHLC fiction. The Venn diagram of those three requirements produces a strategy that works beautifully and fires almost never.
Drop to 30-minute for more trades — ~304 over the same period, ~10/month. But faster timeframes are exactly where the death gradient lives. You’re trading frequency against edge, and the math won’t let you have both.
PF 6.7 × 18 trades = a curiosity. PF 0.94 × 304 trades = a slow bleed.
Pick your poison.
The Touch Artifact — One More Body
I tested a “holding pattern” strategy: enter when price touches an existing FVG level, hold for a fixed duration. Bar-level simulation: +91 pips. Felt like a different angle on the same thesis.
Tick data: -452 pips.
The bar’s high or low “touching” an FVG boundary doesn’t mean price actually interacted with that level in any tradeable way. The bar might’ve spiked through in a millisecond — technically a touch, practically unfillable. On tick resolution, those phantom touches become real losses.
Different angle. Same coffin.
The Detection Code (Nothing Wrong Here)
For completeness — the detection works correctly. The strategy is what’s broken.
A Fair Value Gap is a three-candle pattern where the wicks of the first and third candle don’t overlap, leaving a gap in traded prices on the second candle. Theory: price returns to fill inefficiencies.
import pandas as pd
import numpy as np

def detect_fvgs(df: pd.DataFrame, min_gap_atr: float = 0.3) -> pd.DataFrame:
    """
    Detect Fair Value Gaps in OHLC data.

    A bullish FVG occurs when candle[i-1].high < candle[i+1].low
    A bearish FVG occurs when candle[i-1].low > candle[i+1].high

    min_gap_atr: minimum gap size as multiple of ATR to filter noise
    """
    df = df.copy()

    # ATR for filtering
    tr = pd.concat([
        df['high'] - df['low'],
        (df['high'] - df['close'].shift(1)).abs(),
        (df['low'] - df['close'].shift(1)).abs()
    ], axis=1).max(axis=1)
    df['atr'] = tr.rolling(14).mean()

    fvgs = []

    for i in range(1, len(df) - 1):
        prev_high = df['high'].iloc[i - 1]
        prev_low = df['low'].iloc[i - 1]
        next_high = df['high'].iloc[i + 1]
        next_low = df['low'].iloc[i + 1]
        atr = df['atr'].iloc[i]

        if pd.isna(atr) or atr == 0:
            continue

        # Bullish FVG: gap between prev high and next low
        if next_low > prev_high:
            gap_size = next_low - prev_high
            if gap_size >= min_gap_atr * atr:
                fvgs.append({
                    'timestamp': df.index[i],
                    'type': 'bullish',
                    'gap_top': next_low,
                    'gap_bottom': prev_high,
                    'gap_size': gap_size,
                    'gap_atr': gap_size / atr,
                    'mid': (next_low + prev_high) / 2,
                })

        # Bearish FVG: gap between next high and prev low
        if prev_low > next_high:
            gap_size = prev_low - next_high
            if gap_size >= min_gap_atr * atr:
                fvgs.append({
                    'timestamp': df.index[i],
                    'type': 'bearish',
                    'gap_top': prev_low,
                    'gap_bottom': next_high,
                    'gap_size': gap_size,
                    'gap_atr': gap_size / atr,
                    'mid': (prev_low + next_high) / 2,
                })

    return pd.DataFrame(fvgs)
The Damning Baseline
Beyond the tick autopsy, there’s an uglier truth. I built a random baseline — pick arbitrary price levels at FVG-sized distances, measure how often price returns:
def random_baseline_fill_rate(df, n_samples=1000, gap_size_atr=0.5, max_bars=[24, 48, 96, 240]):
    """Generate random price levels and measure how often price returns to them."""
    rng = np.random.default_rng(42)
    results = {n: {'filled': 0, 'total': 0} for n in max_bars}

    valid_indices = range(200, len(df) - 250)
    sample_indices = rng.choice(valid_indices, size=n_samples, replace=False)

    for idx in sample_indices:
        atr = df['atr'].iloc[idx]
        # Random level near current price
        level = df['close'].iloc[idx] + rng.choice([-1, 1]) * gap_size_atr * atr

        for window in max_bars:
            end_idx = min(idx + window, len(df))
            future = df.iloc[idx + 1:end_idx]
            results[window]['total'] += 1

            if future['low'].min() <= level <= future['high'].max():
                results[window]['filled'] += 1

    return {n: r['filled'] / r['total'] for n, r in results.items()}
At 240 bars, FVG fill rates and random fill rates converge. “FVGs always fill” is barely distinguishable from “prices wander around and eventually touch nearby levels.” A coin flip returns to zero. A price revisits a level 8 pips away. The gap isn’t special. Proximity is.
This is the part that should make ICT traders uncomfortable. Not that FVGs don’t fill — they do. But so does every other arbitrary line you draw near the current price, given enough time.
FVG Walls — Stacking Dead Signals
I also explored “FVG Walls” — zones where 3+ FVGs cluster within 1 ATR. The intuition: more gaps in a zone means stronger gravitational pull.
def find_fvg_walls(fvgs: pd.DataFrame, price: float, atr: float,
                    cluster_distance: float = 1.0, min_cluster: int = 3) -> list[dict]:
    """
    Find FVG Wall zones where multiple unfilled FVGs cluster.

    A wall is defined as 3+ FVGs within cluster_distance * ATR of each other.
    """
    # Filter to unfilled FVGs
    active = fvgs[~fvgs['filled']].copy()

    if len(active) < min_cluster:
        return []

    # Sort by midpoint
    active = active.sort_values('mid')
    walls = []

    i = 0
    while i < len(active):
        cluster = [active.iloc[i]]
        j = i + 1

        while j < len(active):
            if abs(active.iloc[j]['mid'] - cluster[-1]['mid']) <= cluster_distance * atr:
                cluster.append(active.iloc[j])
                j += 1
            else:
                break

        if len(cluster) >= min_cluster:
            mids = [c['mid'] for c in cluster]
            walls.append({
                'zone_top': max(c['gap_top'] for c in cluster),
                'zone_bottom': min(c['gap_bottom'] for c in cluster),
                'zone_mid': np.mean(mids),
                'n_fvgs': len(cluster),
                'strength': sum(c['gap_atr'] for c in cluster),
                'direction': 'bullish' if sum(1 for c in cluster if c['type'] == 'bullish') > len(cluster) / 2 else 'bearish',
            })

        i = j

    return walls
Code works fine. Never validated the trading results. When the base signal is dead on tick data, clustering dead signals doesn’t perform necromancy. It just builds a bigger coffin.
The Fractal Cascade (One Interesting Corpse Detail)
One finding I want to document before shoveling dirt:
Daily-generated FVGs lose money when traded on the daily timeframe: -216 pips. But use daily FVGs as context and enter on 4H bars — +2,505 pips, PF 1.17, 1,034 trades out-of-sample.
The timeframe that generates the signal isn’t always the one that trades profitably. Higher-timeframe structure creates lower-timeframe opportunity. That’s genuinely interesting.
PF 1.17 on 1,034 trades is the only FVG result with any pulse. But after watching daily’s 4.28 collapse to 1.04 on ticks, after the touch artifact flipping +91 to -452, after every other number dying on contact with reality — I wouldn’t bet on this one surviving either.
Last heartbeat before flatline. Not a recovery.
Why It Actually Dies
FVGs are real microstructure events. Price did move fast enough to skip a range. But “price returns to fill inefficiencies” smuggles in two very different claims:
Observation: Prices revisit nearby levels. True. This is random walk behavior. A coin flip eventually returns to zero. Price eventually revisits a level 8 pips away. This requires no mechanism, no force, no market-maker conspiracy. Just brownian motion.
Causation: Gaps create magnetic pull. This would need unfilled resting orders, market makers defending levels, some persistent mechanism across bars. Something that causes the return, not just the statistical near-certainty of revisitation.
42 million ticks say the causal claim is either wrong or too weak to monetize. Whatever microstructure effect exists at gap formation drowns in noise within minutes. By the time you can act on it, the signal-to-noise ratio is already underwater.
And the OHLC candles flatter it because bar-level trade resolution systematically misplaces where your stop and target actually trigger. This is the same bias that kills most price-action strategies when you move from “backtest on TradingView” to “execute with real fills.” FVGs just happen to be the clearest victim.
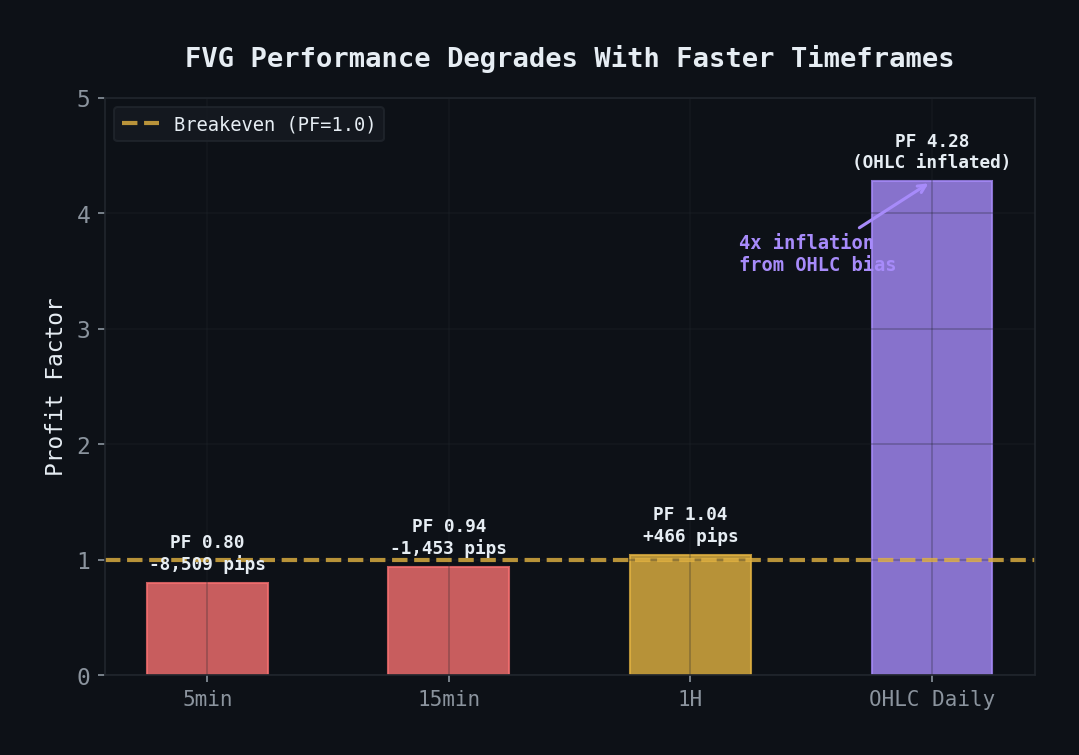 Monotonic degradation: OHLC daily (PF 4.28, artifact) → 1H (1.04) → 15min (0.94) → 5min (0.80). The resolution is the edge.
What I Buried With It
OHLC backtests are fiction. 4× profit factor inflation from bar-level bias. If you’re not running tick data, your backtest is a bedtime story. This isn’t an FVG problem — it’s a every price-action strategy problem.
Fill rate is not alpha. Everything near the current price gets revisited eventually. A 78% fill rate is impressive until you run the baseline and realize random lines fill at the same rate. Most traders never take this step.
Monotonic degradation = OHLC signature. Strategy improves as bars get fatter, peaks at the coarsest resolution? You’re trading the simulation, not the market. The bars are the edge. Bars aren’t real.
Ceilings matter more than optima. The best possible FVG configuration yields PF 1.114. Knowing the ceiling before deciding whether to trade is the difference between a quantitative researcher and a gambler.
Frequency × edge = the real constraint. PF 6.7 that fires 18 times in 2.5 years is a fun fact, not an income stream. A strategy isn’t tradeable until both numbers work simultaneously.
Touch detection on bars is a lie. +91 pips on bars, -452 on ticks. The “touch” your candle shows you might be a millisecond spike no human or algorithm could fill.
The gap fills. You still lose money.
Rest in peace.
One of many strategies tested and killed. For the full graveyard tour, see 31 Strategies Tested, 4 Survived. For another honest postmortem, see The Hurst Exponent Lied to Us.