ECVT EURUSD 1H
Asset: EURUSD TF: 1H
PF1.44
WR41%
Pips+198
Trades44
PF 1.44 on 44 trades — insufficient sample size. Failed to transfer to EURGBP or any equity. Inconclusive.
Performance first. Every tracked strategy appears here with PF, win rate, pips, trades, and survival status.
Each card shows the current state of a strategy, including dead systems we keep public on purpose.
Asset: EURUSD TF: 1H
PF 1.44 on 44 trades — insufficient sample size. Failed to transfer to EURGBP or any equity. Inconclusive.
Asset: EURGBP TF: 1H
PF 0.76 and negative expectancy. Failed transfer, strategy archived.
Asset: EURUSD TF: 1H
PF 1.10 with 55% WR across 601 trades. Alive but still under testing.
Asset: EURUSD TF: 4H
Looked profitable before tick verification. Marked dead due to execution bias.
Asset: EURUSD TF: 1H
PF near breakeven with no robust edge after realistic execution costs.
Asset: EURUSD TF: 15m
PF 0.94 and deep drawdown profile. Strategy is formally dead.
Asset: EURUSD TF: 5m
PF 0.80 with severe loss profile. Tick data killed the hypothesis.
Asset: EURUSD TF: 1H
PF 0.53 with large negative pips. Mean-reversion leg removed from stack.
Asset: Crypto TF: 1H
Signal fired on every bar. Phantom regime detector with zero selectivity.
Asset: multi-asset TF: research-only
Interesting analogy, wrong asset class dynamics. Kept as dead reference.
Asset: multi-asset TF: multi-TF
Combined signals underperformed components. Simpler decomposition won.
Failure is not hidden here. Dead systems stay visible because they are part of the research asset.
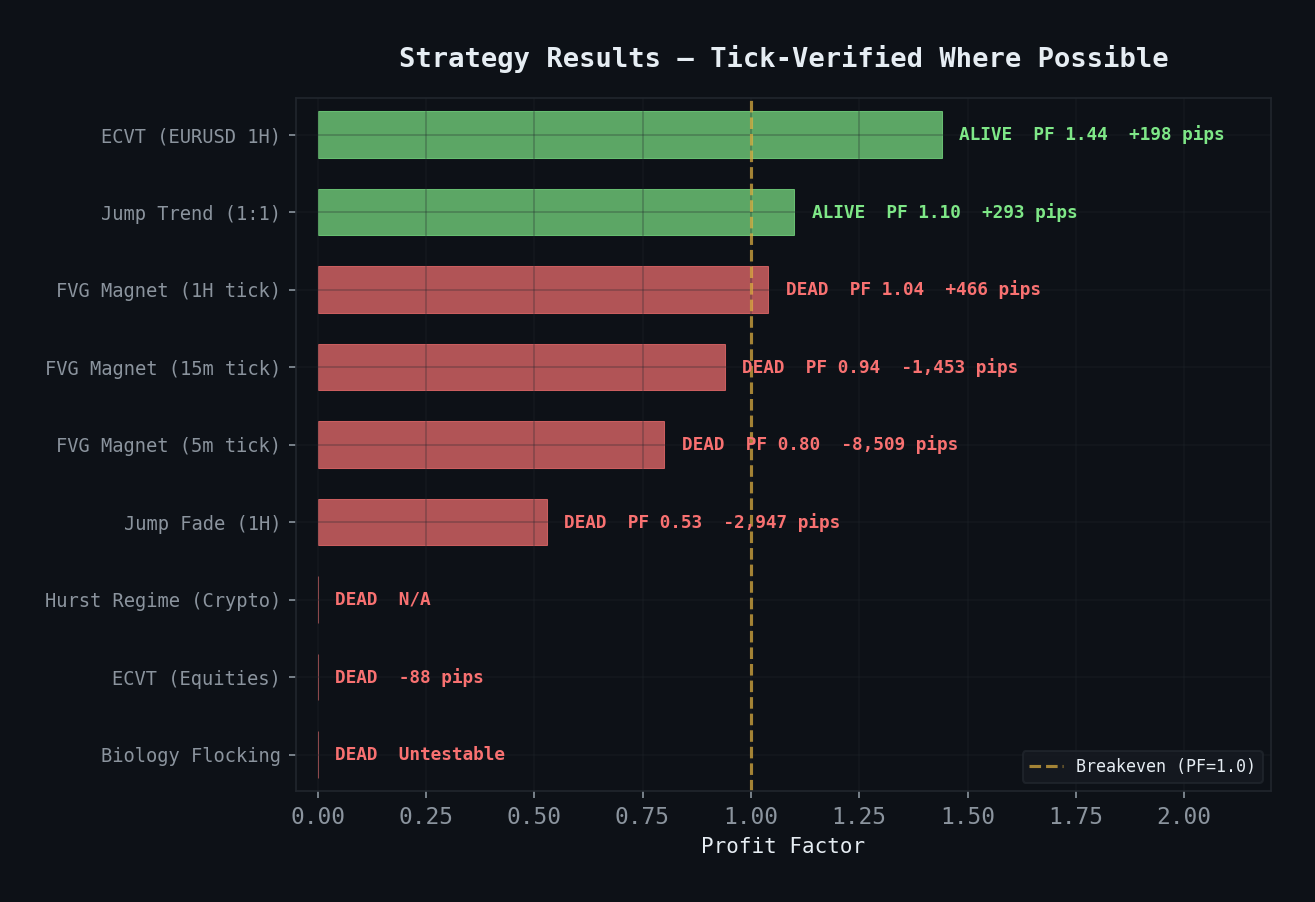
Green bars survive above PF 1.0. Red bars are failed hypotheses preserved for auditability.
Follow live updates in Discord for new cards, regime breaks, and post-mortems when strategies die.
Join curupira-hq